Industry Insights
Valuable insights from UPCEA's trusted corporate partners.
How Higher Education Marketing Metrics Help You Boost Enrollment
As the higher education sector faces a demographic cliff and shrinking demand for undergraduate degrees, institutions are searching for new ways to secure long-term growth.
According to a new report from the National Center for Education Statistics, more than 100 colleges have closed their doors over the past two years, and the sector has shrunk by 2%. As the traditional undergraduate market narrows, a promising opportunity emerges in an often-overlooked group: adult learners.
This demographic, comprised of students aged 25 and older, offers a total addressable market far greater than the traditional undergraduate population. For universities, tapping into this vast market represents a key strategy to future-proof their institutions while navigating a rapidly changing playing field.
However, reaching adult learners requires a thorough understanding of their unique interests and goals. These students tend to prioritize career advancement, flexibility, and the quality of the programs they choose rather than the college’s overall brand. They also hold the power to choose if and when they go back to school.
To cut through the clutter and effectively reach this new learner type, your university will need to refine its historical marketing approach, using data-driven insights to invest in the most profitable channels.
Creating a proper strategy starts with zeroing in focus on the metrics that truly matter for enrollment success.
Your North Star for Enrollment Performance
Two largely neglected higher education digital marketing metrics, cost per inquiry (CPI) and cost per enrolled student, are the compass points guiding you toward smarter investments based on real-world data.
In higher education marketing, campaign-level metrics like cost per click and click-through rate are often referenced for success and to identify optimizations. While these metrics do play a role in understanding audience engagement, they only tell part of the story.
The real measure of effectiveness lies in how well your marketing efforts translate into meaningful outcomes, like inquiries and enrollments.
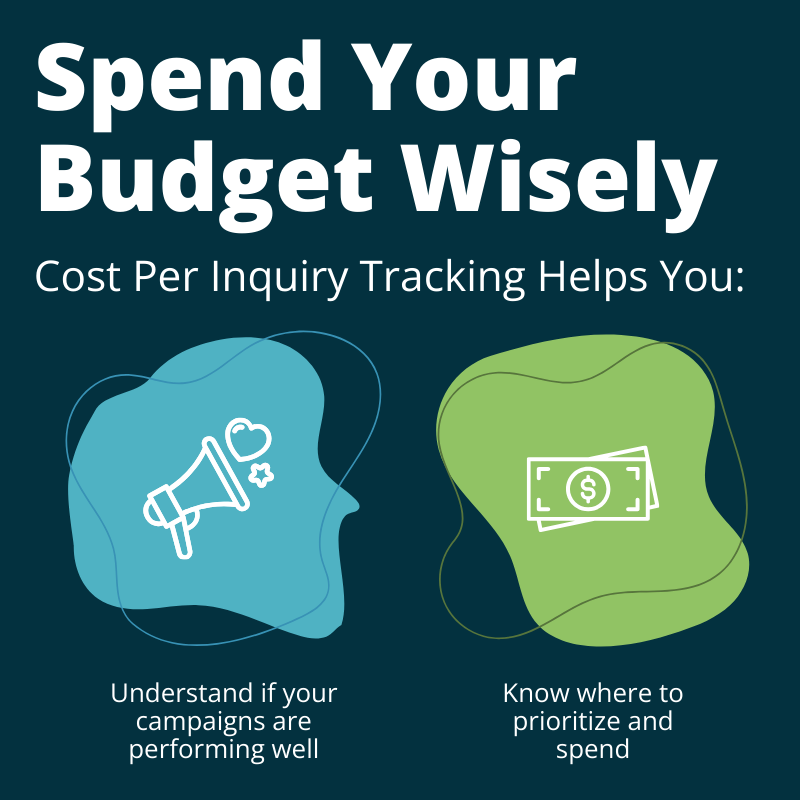
CPI tells you how efficiently your budget works by dividing your total spending by the number of inquiries received. Understanding CPI gives you a clear view of how well your marketing is attracting interest. Considering the marketing investment to reach the adult learner, tracking CPI is critical to reduce budget waste.

Cost per enrolled student goes beyond inquiries, capturing the total cost of securing a student’s enrollment, from the start of your campaign to the student’s actual matriculation. It offers valuable insight into the overall success of your marketing in converting interest into actual enrollments.
By tracking the right costs, universities will base marketing decisions on enrollment outcomes rather than just advertising activity — leading to more efficient resource allocation and, thus, more actionable results.
2024 Higher Education Marketing Metrics Research Study Insights
In our UPCEA x Search Influence survey research, “Higher Ed Marketing Metrics Research Study: What Gets Measured Gets Managed,” we explore how universities are (or aren’t) using key metrics to guide their marketing efforts.
The research revealed a striking correlation between tracking costs and campaign satisfaction: 92% of marketers who are confident in their ability to track are also satisfied with their marketing performance.

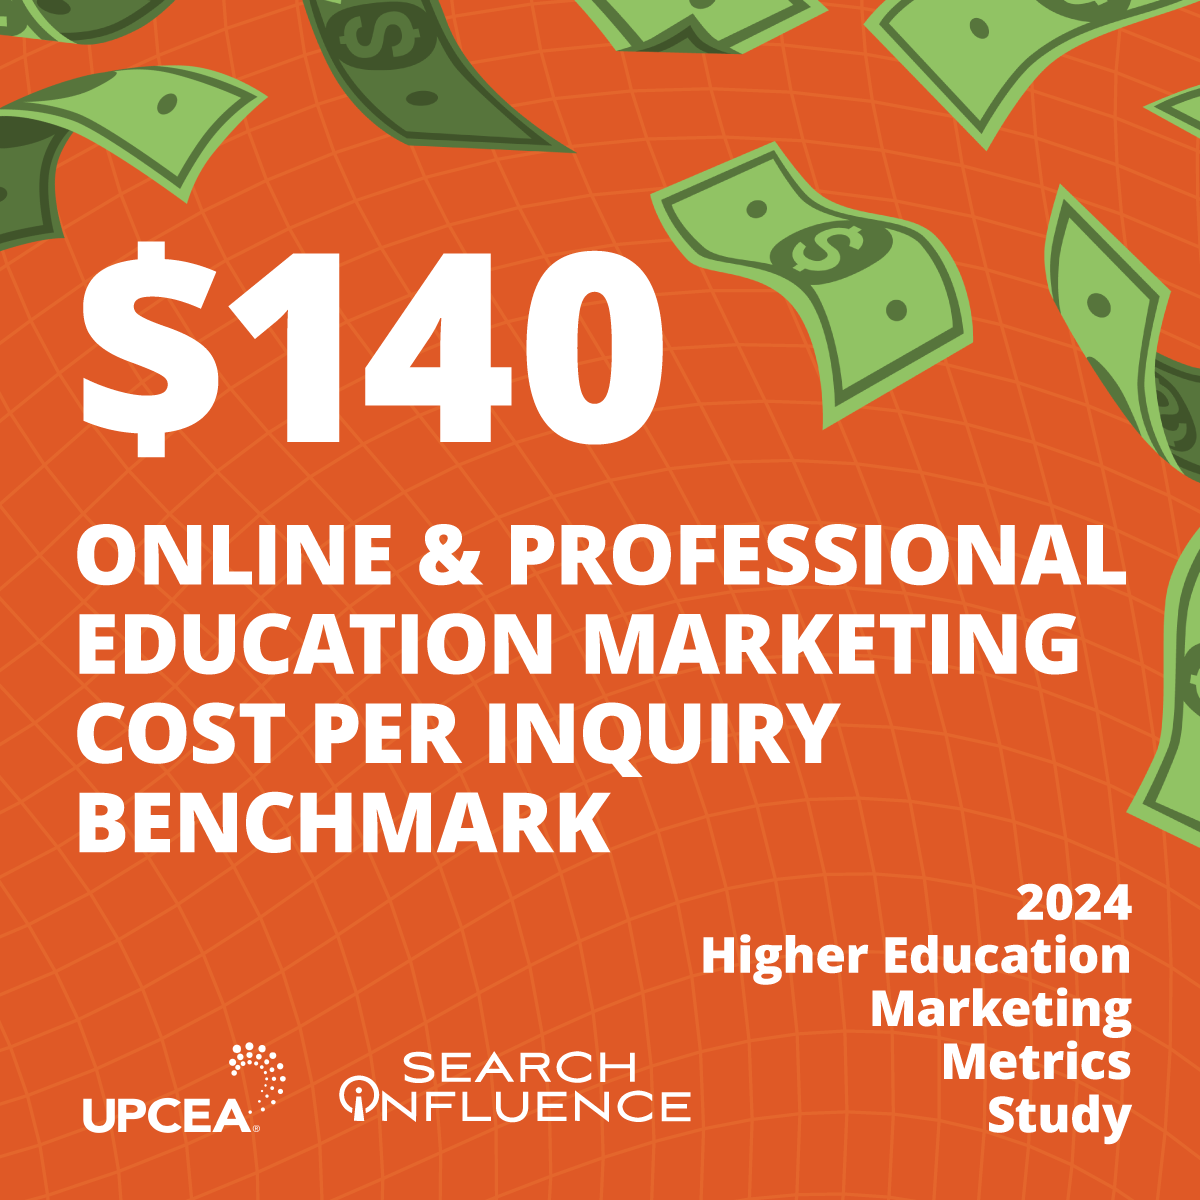
The two most telling key performance indicators for higher education marketing, CPI and cost per enrolled student, serve as benchmarks for evaluating the effectiveness of advertising investments. The study found that the average CPI for universities was $140, while the average cost per enrolled student came in at $2,849.
However, the study also exposed a significant gap: less than half of online and professional education marketers track these metrics, with only 46% monitoring CPI and just 43% tracking cost per enrolled student. Given that online and professional education programs invest an average of $800,970 annually in digital media, those that don’t track these metrics risk wasting budget and missing opportunities to improve outcomes.
Consistently tracking CPI — whether on a daily, weekly, or monthly basis — along with cost per enrolled student by cohort or semester provides universities with a clearer understanding of lead quality and the true impact of their marketing strategy.
Institutions that embrace this approach are better poised to make informed decisions that drive higher returns on their marketing investments and lead to sustainable growth. The data gathered will not only show which programs are resonating with your target audience but can also guide broader decisions, from refining course offerings to shaping your institution’s brand.
Strategies for Setting Marketing Benchmarks in Higher Education Institutions
Setting the right higher education marketing benchmarks creates a North Star for success. For your university to optimize its marketing and hit enrollment goals, you’ll need benchmarks that align with those objectives — not just generic metrics, but personalized targets that reflect your institution’s unique situation.
To build a framework that works, your benchmarks should draw from three key areas:
- Your Historical Data: Look at what’s already been working (or not working). Your own marketing performance over time tells a story that can help set realistic, achievable goals tailored to your institution.
- Industry Benchmarks: See how you stack up against others in the field. Knowing where your institution stands in comparison to industry peers is crucial for identifying gaps and opportunities for growth.
- Broader Benchmarks: Don’t limit yourself to just higher ed. Marketing wisdom from other sectors can offer fresh perspectives and innovative strategies that might help refine your approach.
In following these best practices for higher education marketing benchmarks, you’ll have a clear sense of direction, helping you assess your campaigns and make smart adjustments along the way. The more you focus on these data-driven strategies, the more impactful your outcomes will be, whether it’s boosting enrollment, enhancing the student experience, or simply staying afloat in the turning tides.
For further insight into the most effective marketing benchmarks for universities and colleges, download our 2024 Higher Education Marketing Metrics Research Study here.
Paula French is a Director at Search Influence, a leading digital marketing agency specializing in higher education. With over 15 years of experience crafting and leading digital marketing campaigns for major organizations, Paula has a proven track record of helping institutions like Tulane School of Professional Advancement effectively reach and engage their target audiences.
