Leadership at the Crossroads
The state of higher education today is new for most institutions and disruptive for many. Having to lead through disruption can be rewarding yet risky. Leaders may have experience in continuing and online education, as well as strong business and operational insights, but do they have good intuition into the impact of alternative credentialing and increased competition in online? Do leaders have what it takes to guide not only their staffs through change, but bring campus administrators and faculty along for the ride? With higher education at an economic crossroads, can institutions attract new talent, as well as retain top talent, in the midst of chaos, disruption and opportunity?
At first glance, the professional, continuing and online education (PCO) leader received a small raise between 2014 and 2018 according to UPCEA’s Salary, Staff and Structure surveys. The most recent survey was conducted in the spring of 2018. During that four-year period, much has changed as more institutions moved degrees fully online, created massive open online courses (MOOCs)and/or invested into alternative credentialing. As a result, portfolios have become more complex and competition has increased. Upon further review of leader salaries and factoring in adjustments for inflation, data shows that some leaders actually may have lost ground financially.
Overall, the salary of the top administrator of PCO units has decreased (Table 1) when adjusted for inflation (real wages), with small institutions (those with PCO units with gross revenue less than $5 million) experiencing the largest drop in real wages (-16%). Medium institutions (those with gross revenue between $5 million and $15 million) had the second highest decrease in real wages (-6%), followed by public institutions (-6%) and large institutions (those with gross revenue over $15 million). Private institutions are the only segment that saw real wages increase from 2014 to 2018.
Table 1: Average Top Administrator Salary by Institution Size and Type (2014-2018)

The data (Table 2) shows that salary differs based on the title of the administrator, as Executive Directors had the largest decrease in terms of real dollars (-7%), followed by Deans (-6%) and Associate Vice President/Chancellor (-2%). Assistant Vice President/Chancellor had the largest increase (54%), followed by Director (15%) and Associate or Vice Provost (14%). Caution should be taken when interpreted with small sample sizes.
Table 2: Average Top Administrator Salary by Title, 2014 versus 2018*
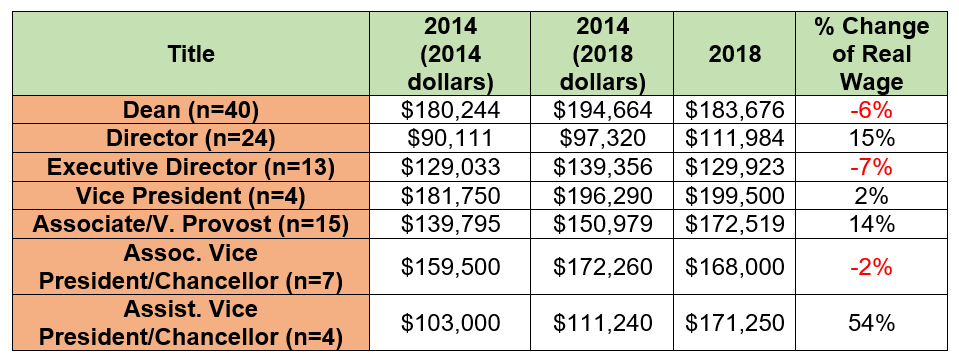
*sample sizes are for 2018 data
A review of the salaries for the top administrators of departments (Table 3) within the PCO unit (and not the top leader) shows the top executive/professional education administrator experienced the largest loss of real wages (-12%), followed by the marketing head (-10%) and the finance/operations administrator (-8%). The largest positive real wage changes were for the top administrators in charge of corporate training/partnerships (8%), online/distance learning (4%) and summer session (4%).
Table 3: Average Salaries of Top Department Administrators*
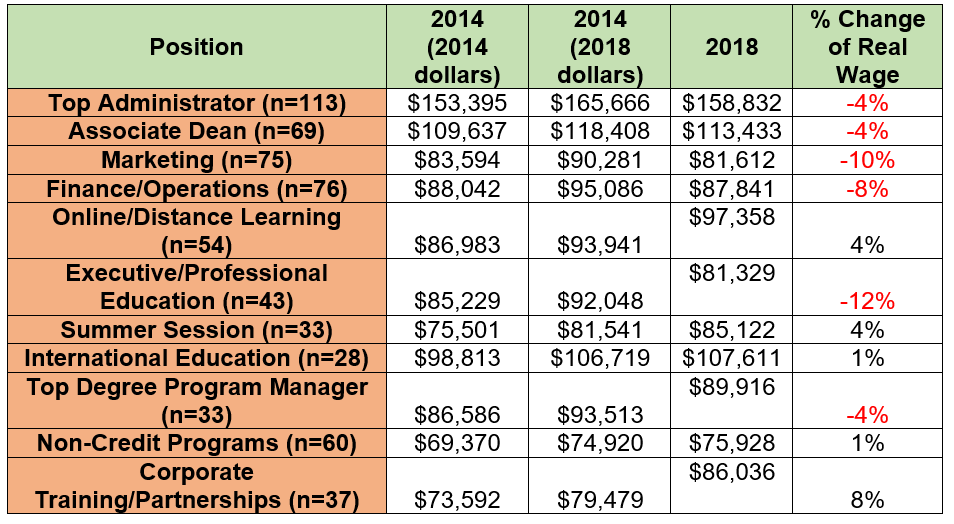
*sample sizes are for 2018 data
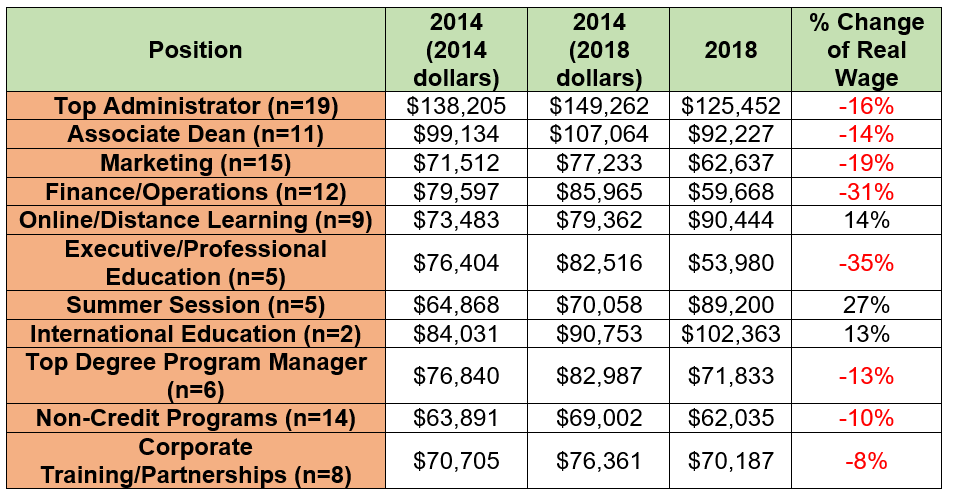
An analysis was also conducted based on size of the institution (Tables 4-6). The largest real wage decreases among the top department administrators of small institutions were in executive/professional education, which saw a 35% decrease, followed by finance/operations administrators (-31%) and marketing administrators (-19%). Summer session administrators saw the largest real wage increase (27%), followed by online/distance learning (14%) and international education (13%).
Table 4: Average Salaries of Top Department Administrators – Small Institutions
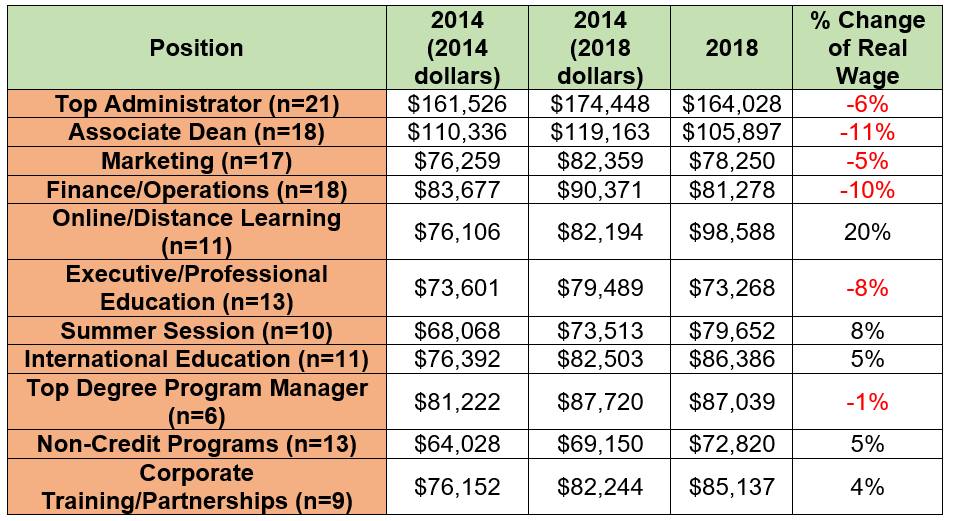
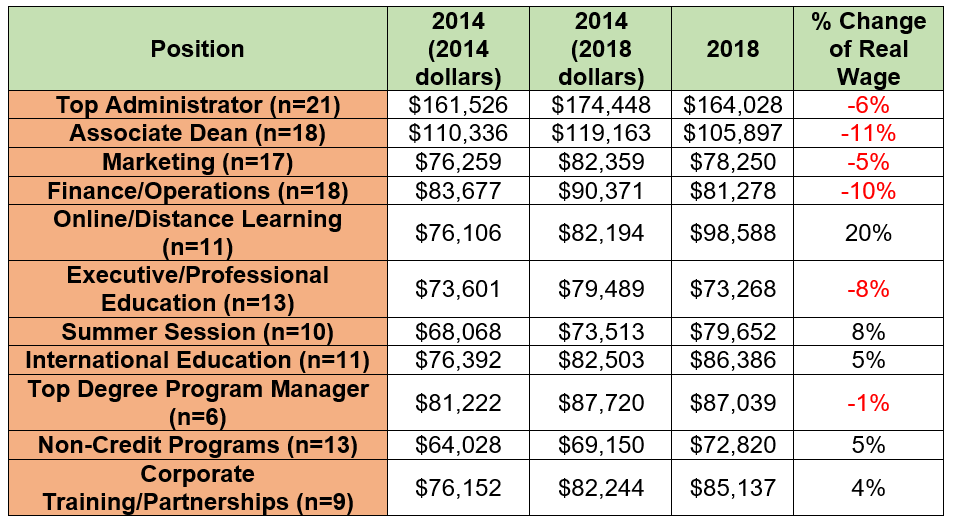
Online/distance learning administrators saw a significant increase in real wages among medium institutions, 20%. Summer session administrators (8%), international education administrators (5%) and non-credit programs (5%) had the next largest increases. The associate dean (-11%), finance/operations (-10%) and executive/professional education (-8) administrators saw the largest decreases in real wages.
Table 5: Average Salaries of Top Department Administrators – Medium Institutions
Changes in the real wage at large institutions were less volatile than the other two revenue sizes, with the largest increase going to top corporate training/partnership administrators (8%), followed by both online/distance learning administrators and summer session administrators seeing increases of 4%. Executive/professional education administrators (-12%), marketing administrators (-10%) and finance/operations administrators (-8%) saw the largest of the decreases.
Table 6: Average Salaries of Top Department Administrators – Large Institutions
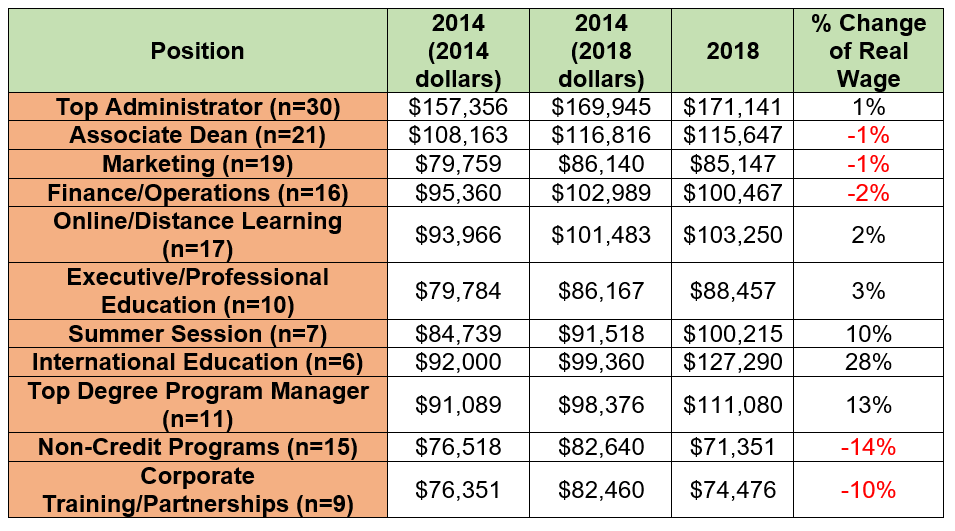
An analysis was also conducted based on whether the institution was public or private (Tables 7-8). Six of the top department administrators in private institutions did not see a significant change in their real wages between 2014 and 2018, changing by only +/- 3%. International administrators had the largest increase, going up 28% from 2014, followed by top degree program managers (13%) and summer session administrators (10%). Non-credit program administrators saw the largest decrease, falling 14%, followed by corporate training/partnership administrators (-10%).
Table 7: Average Salaries of Top Department Administrators – Private Institutions
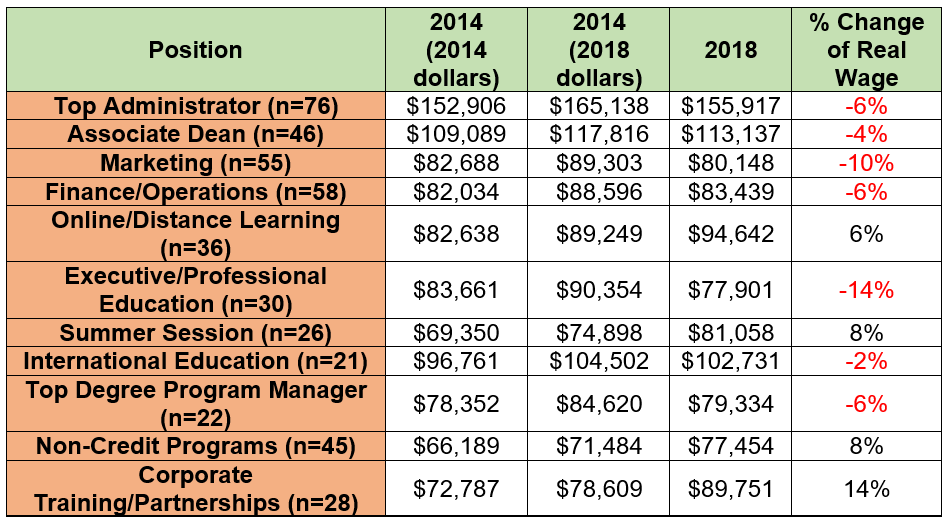
The average corporate training/partnership administrator at a public institution saw the largest increase in real wages, going up by 14% from 2014. Summer session administrators and non-credit program administrators saw an increase of 8%. The average executive/professional education administrator had the largest decrease, losing 14%, followed by top marketing administrators with a decrease of 10%.
Table 8: Average Salaries of Top Department Administrators – Public Institutions
Learn more about UPCEA's expert consultants.
Do you need help with your PCO unit or campus? We can help. Contact UPCEA Research and Consulting for a brief consult. Email [email protected] or call us at 202-659-3130.
Trusted by the nation's top colleges and universities, UPCEA Research and Consulting provides the best value in the industry today. UPCEA's industry experts have years of experience in Online and Professional Continuing education - put them to work for you!
UPCEA Research and Consulting offers a variety of custom research and consulting options through an outcomes-focused pricing model. Find the option(s) that best suit your institution.
Learn more about UPCEA Research & Consulting
The UPCEA Difference
Unmatched Experience: For more than 100 years, UPCEA consultants have exclusively served the needs of online and professional continuing education programs. UPCEA consultants leverage their extensive industry expertise to expedite solutions, anticipate upcoming shifts, and offer distinct best practices, effectively aiding clients in achieving their goals.
Cost Effectiveness: As a nonprofit, member-serving organization, we provide unmatched value, allowing you to maximize limited research and consulting budgets.
Action in Motion: Our cadre of experienced, skilled authorities and expert practitioners propels you forward, translating research and consulting into impactful implementation, a distinctive hallmark of UPCEA. Our team of current and former institutional leaders will support you, turning research and consulting into action.
Mission Alignment: Like you, our mission is to enhance and expand educational opportunities and outcomes for adult and other non-traditional learners. We share your values and work in partnership with you to advance access and excellence in education.
